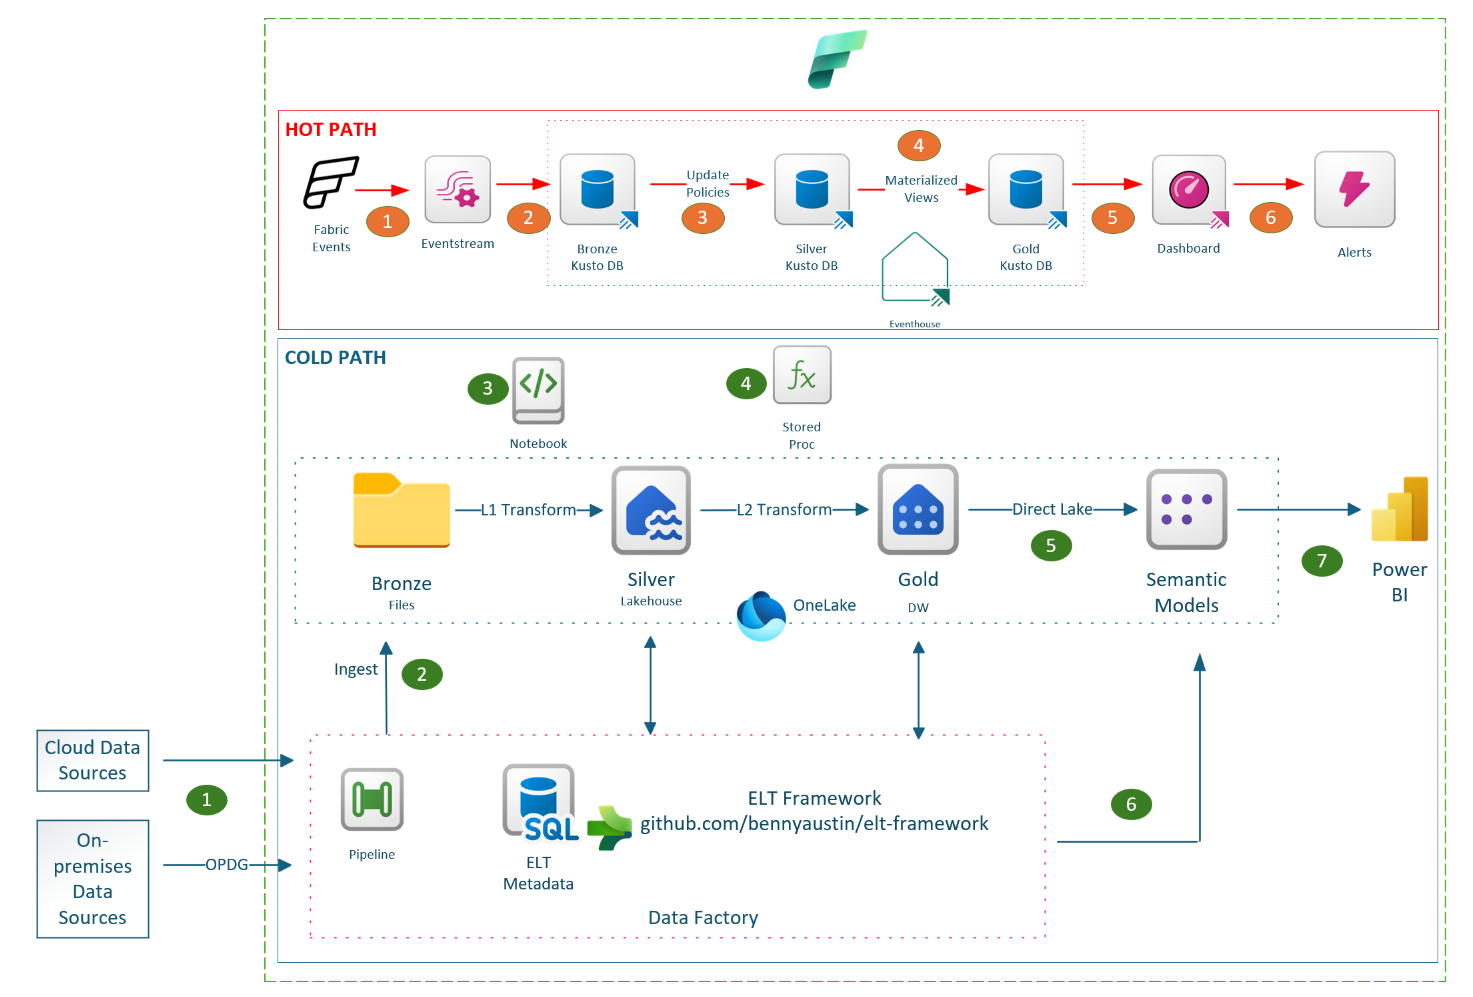
The Fabric Accelerator is a suite of reusable code components integrated with an orchestration framework designed for Microsoft Fabric, supporting both batch and real-time workloads. It enables automated build, deployment and execution of data platforms on Microsoft Fabric in a consistent and repeatable way. At its core is a metadata-driven ELT (Extract, Load, Transform) framework that orchestrates data workflows. With this release, the metadata layer has transitioned from Azure SQL to Fabric SQL, aligning with the broader evolution of Microsoft Fabric.
The transition to Fabric SQL provides these key benefits:
- One less external resource to manage while being fully native to the Fabric ecosystem.
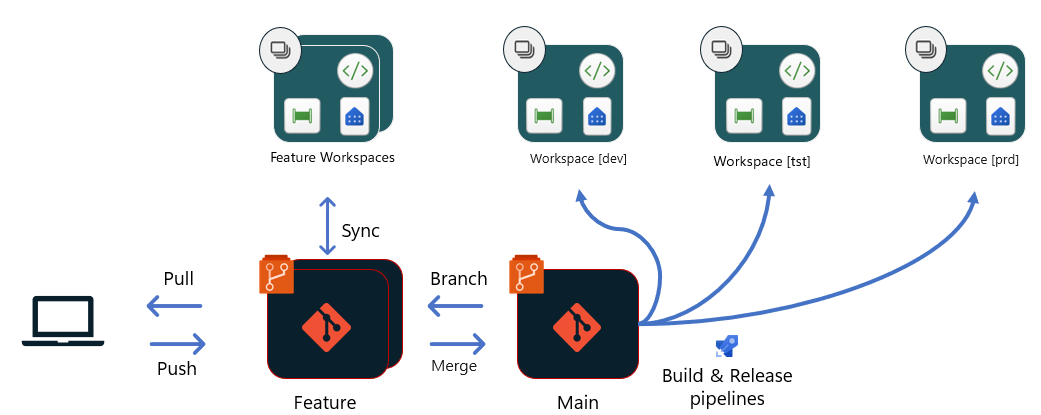
- Simplified build experience for data engineers through VS Code and GitHub integration.
- Autonomous database capabilities through auto-scaling, auto-optimizing and auto-managed HADR.
- Sets the stage for AI driven features through RAG and Vector support.
In addition to Fabric SQL update, a few minor updates also went live in this release. These updates were mainly intended to minimize deployment friction and streamline the overall experience
- Purview DG module removed from Infrastructure-as-Code (IaC) deployment. Data Governance is integral part of data strategy. However, based on feedback to simplify deployment and keep the independence of data governance, it was decided to remove Purview DG bicep module from IaC deployment.
- Event log ADLS Gen2 storage has been removed from the IaC deployment. With the introduction of real-time observability and the option to persist event logs in OneLake, the separate storage for event logs was no longer necessary.
- To reduce dependency on Key Vault during IaC pipeline execution, the Fabric capacity administrator email is now stored as a GitHub repository secret instead of Key Vault secret.
If you are a data engineer and haven’t tried the Fabric Accelerator yet, now’s the time. With Fabric SQL powering the ELT framework, it’s faster, simpler, and ready for AI-driven innovation.