Introducing observability, the first Real-time Intelligence (RTI) workload in Fabric Accelerator. The Fabric Accelerator leverages Fabric events to monitor and alert significant events in real-time, enhancing the observability of your data platform. This observability encompasses all activities within OneLake and all Fabric workspaces, as well as the execution of data pipelines and Spark notebooks.
The following monitoring and alerts are available now
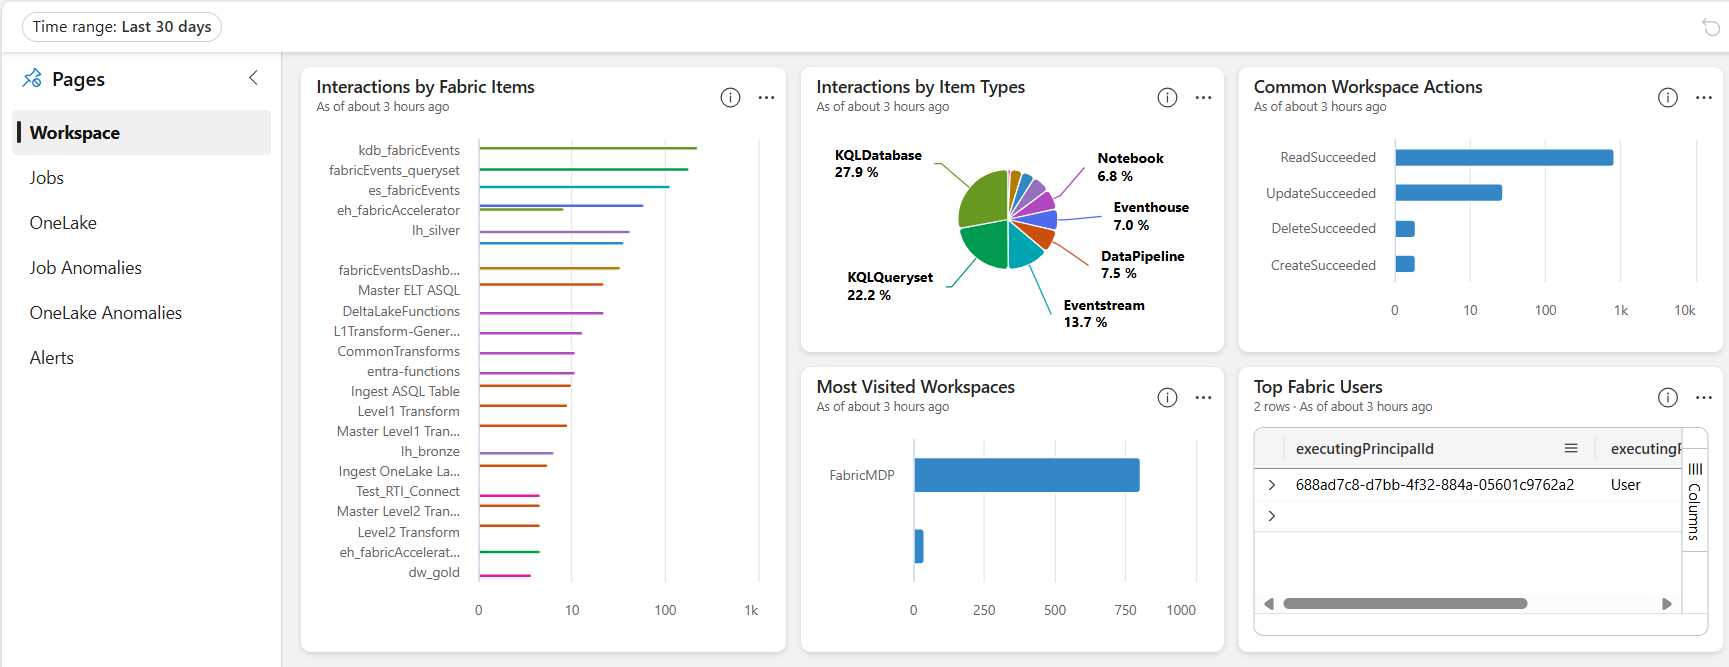
- Frequently used Fabric workspaces, item types, items, users, and user actions.
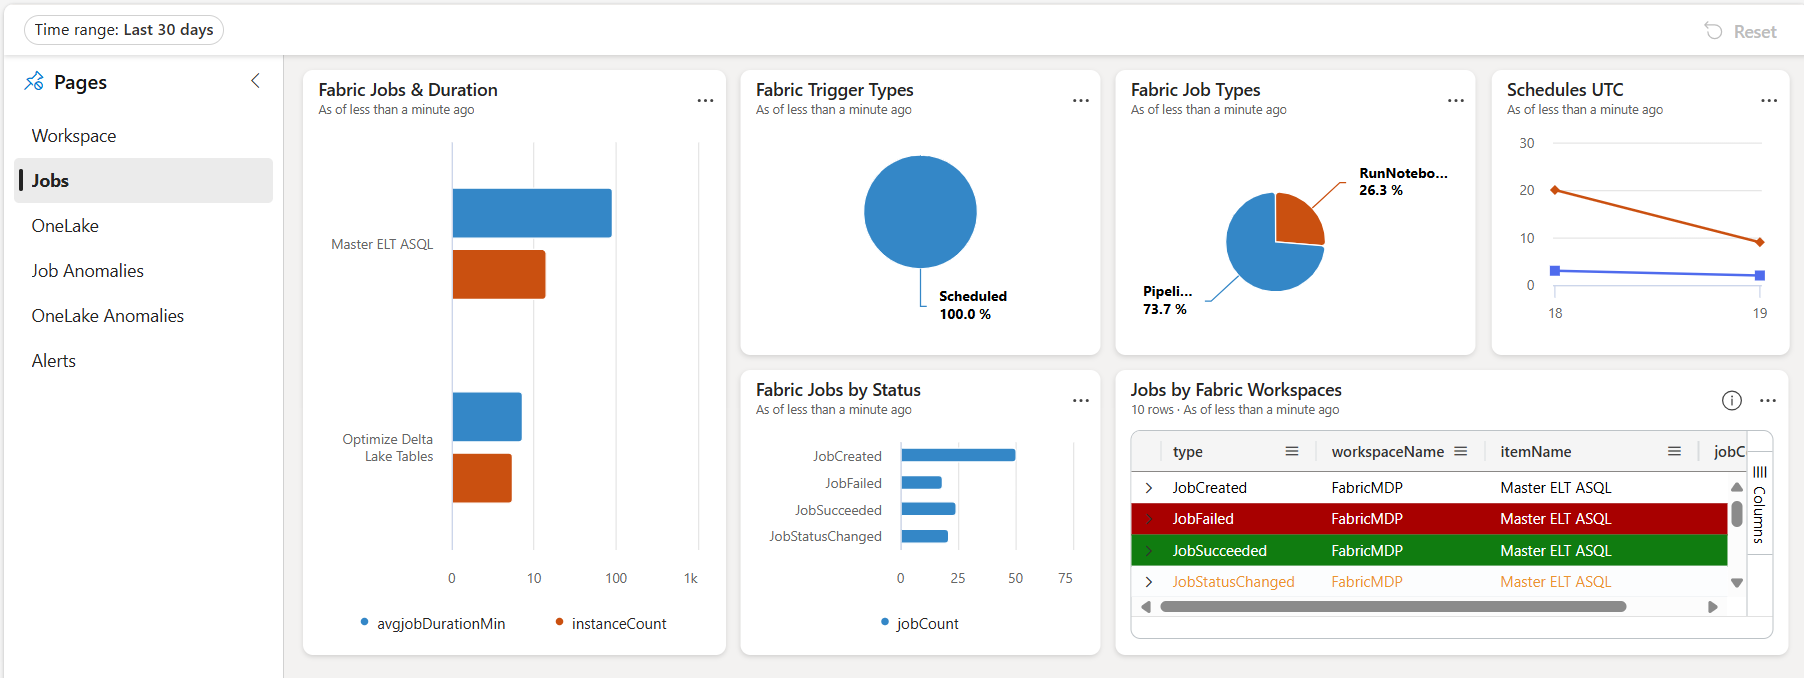
- Frequently run data pipelines and Spark notebooks, including elapsed duration, execution status, trigger types, job types, and schedules.
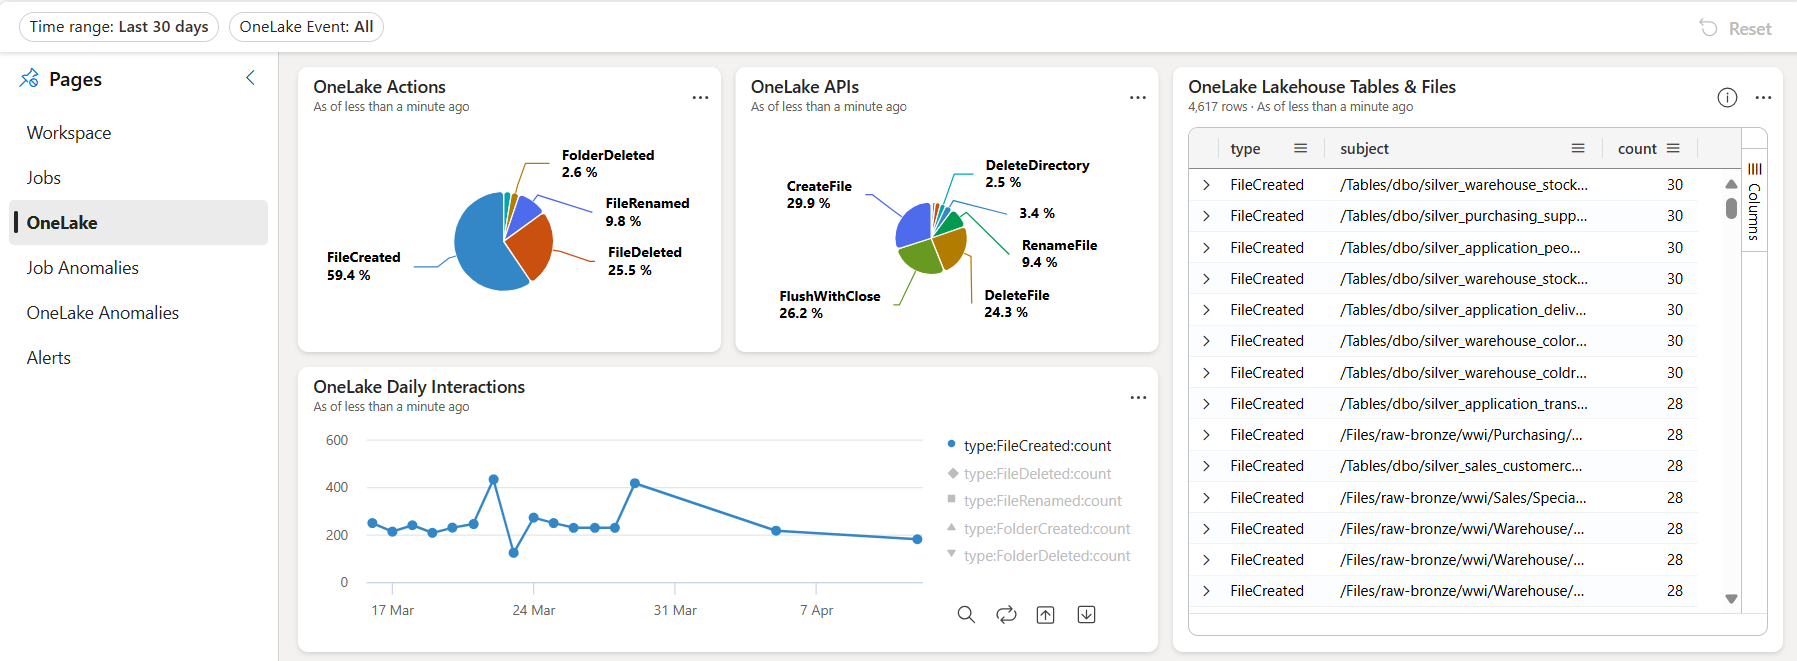
- Frequently used OneLake actions by users.
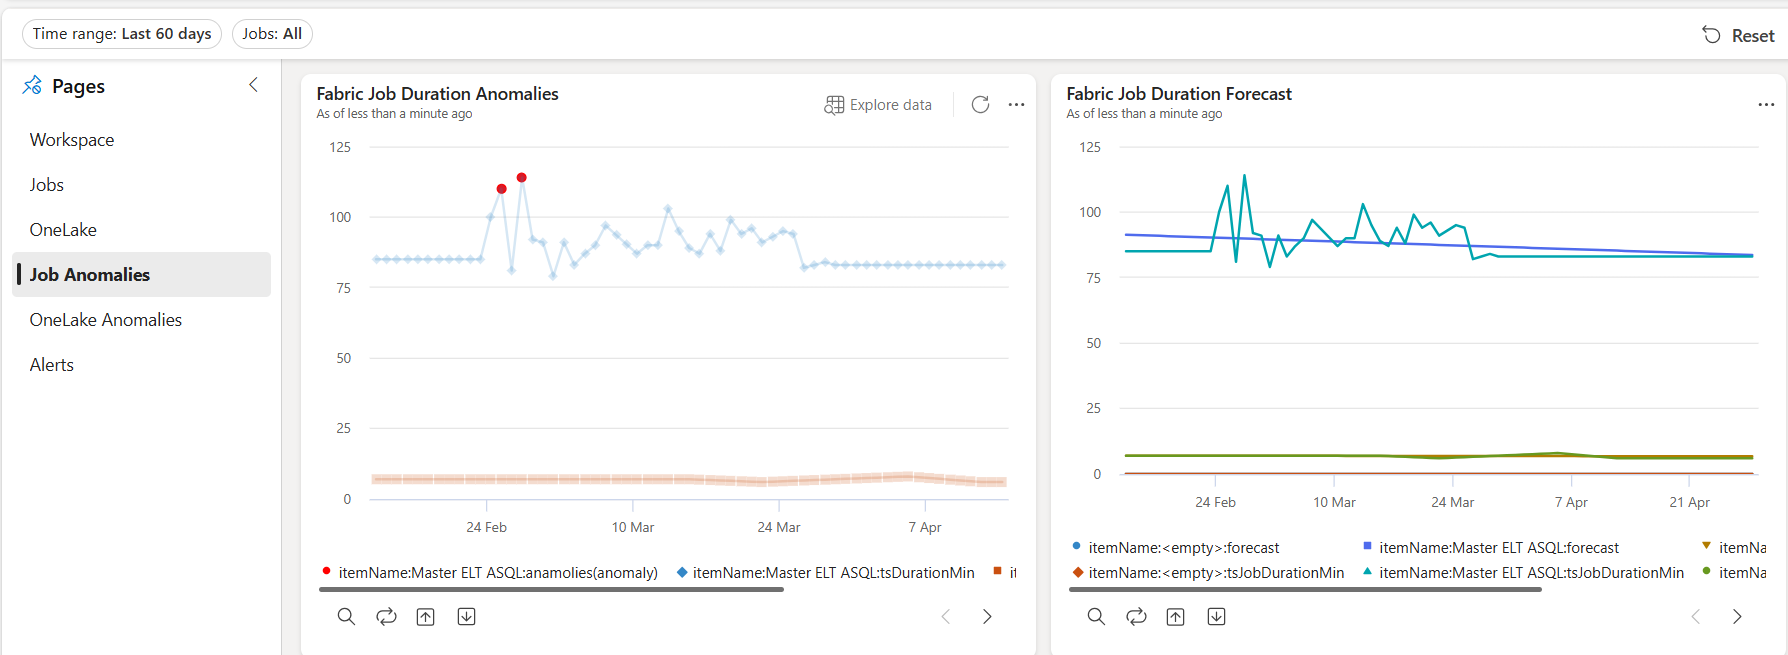
- Alerts for job execution anomalies.
- Alerts for jobs showing regression trends compared to the last 60 days.
- Alerts for OneLake usage anomalies.
- Alerts for new users, among others.
What’s Monitored now?
Workspace Events
Frequently used Fabric workspaces, item types, items, users, and user actions.
Job Events
Frequently run data pipelines and Spark notebooks, including elapsed duration, execution status, trigger types, job types, and schedules.
OneLake Events
Frequently used OneLake actions by users.
Job Anomalies
Data pipeline and Spark jobs execution anomalies
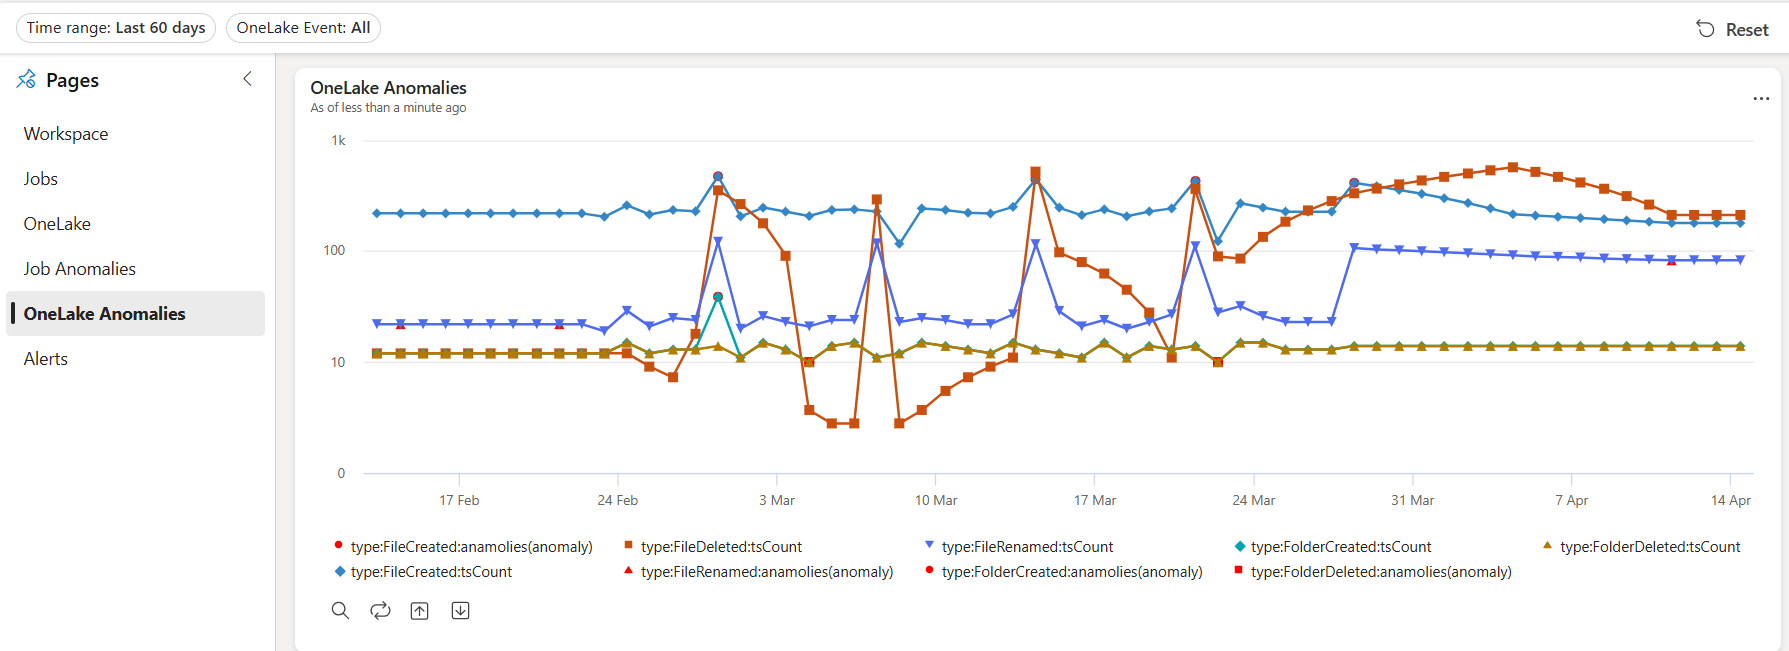
OneLake Anomalies
Unusual usage patterns in OneLake usage
What’s Notified now?
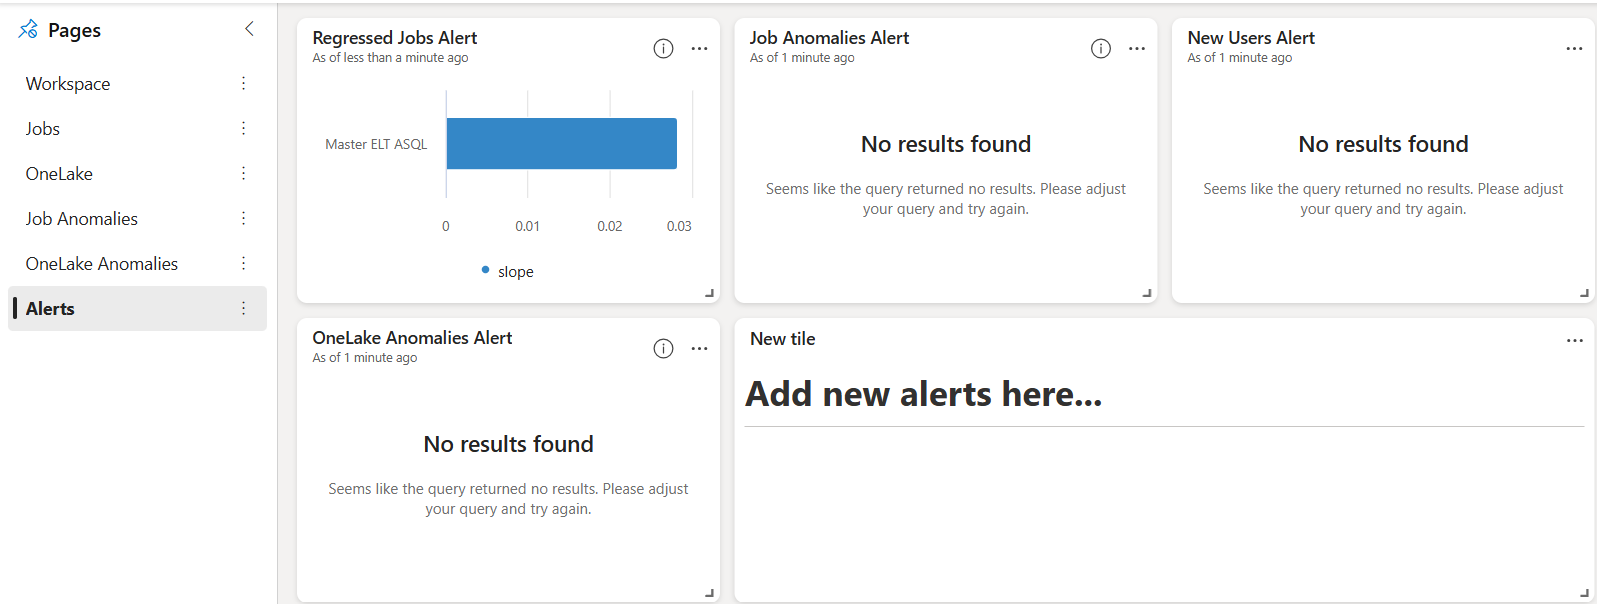
Alerts
- Alerts for jobs showing regression trends compared to the last 60 days.
- Alerts for job execution anomalies
- Alerts for OneLake usage anomalies
- Alerts for new users
If you don’t see data in the alert tiles, it means there are no issues to report, which is a positive outcome.
Architecture
The hot path leverages medallion architecture, incorporating Eventstream, KQL database tables, materialized views, Real-time dashboards and Data Activator alerts.
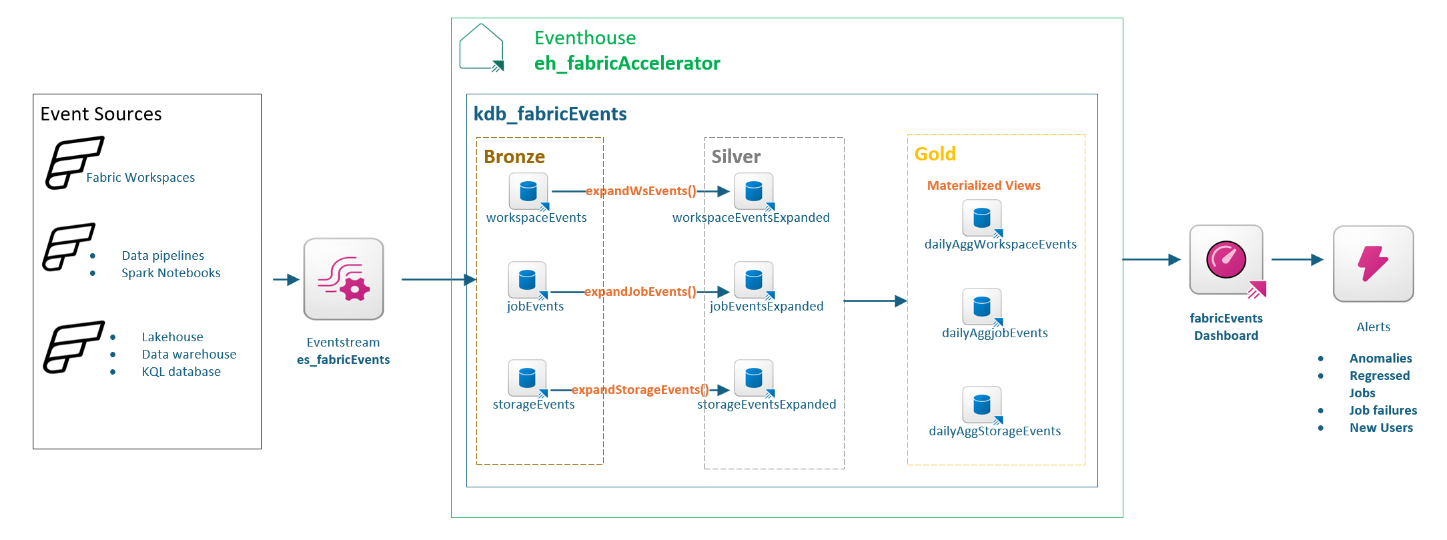
- The Eventstream connects to Fabric events generated by items in your data platform.
- The following data sources are connected to the event stream. Data is sent to event stream when a user or system generated event occurs.
| Connector | Data source |
|---|---|
| Fabric Workspace Item Events | The default workspace for this accelerator |
| Fabric Job Events | Data pipeline Spark notebook |
| Fabric OneLake Events | Lakehouse Datawarehouse |
- The Eventstream then filters data based on the schema of data source type (workspace/job/OneLake) and lands them as-is in KQL database within the Eventhouse. This is the bronze layer. Each data source type has a dedicated Events Kusto table.
- Data in bronze Kusto tables embed key information in JSON columns and may contain duplicates. Update Policies are used to extract data from JSON columns and de-duplicate it in real-time from bronze tables. Each Events table has a corresponding Update Policy that calls a Kusto function expand…() to create Expanded Kusto tables as the silver layer.
- Finally, Kusto Materialized Views are used to obtain daily snapshots of events data from the silver tables. These dailyAgg views form the gold layer for reporting and alerts.
- The Real-Time Dashboard is created from gold layer materialized views, with each tile representing a KQL query.
- Data Activator alerts is created from Real-Time Dashboard tiles.
Getting Started
- Head over to the GitHub repo fabric-accelerator
- For more details about this feature check-out Monitoring and Alerts using Fabric Events
- For more details about the accelerator check-out Wiki

One thought on “Observability in Fabric Accelerator”