Fabric Accelerator setup is now fully automated, delivering faster and simpler deployments. Previously, the process required 15 semi-automated steps and about 2 hours. With this release, it’s streamlined to just a few one-time configurations, followed by a job that completes deployment in 15–20 minutes.
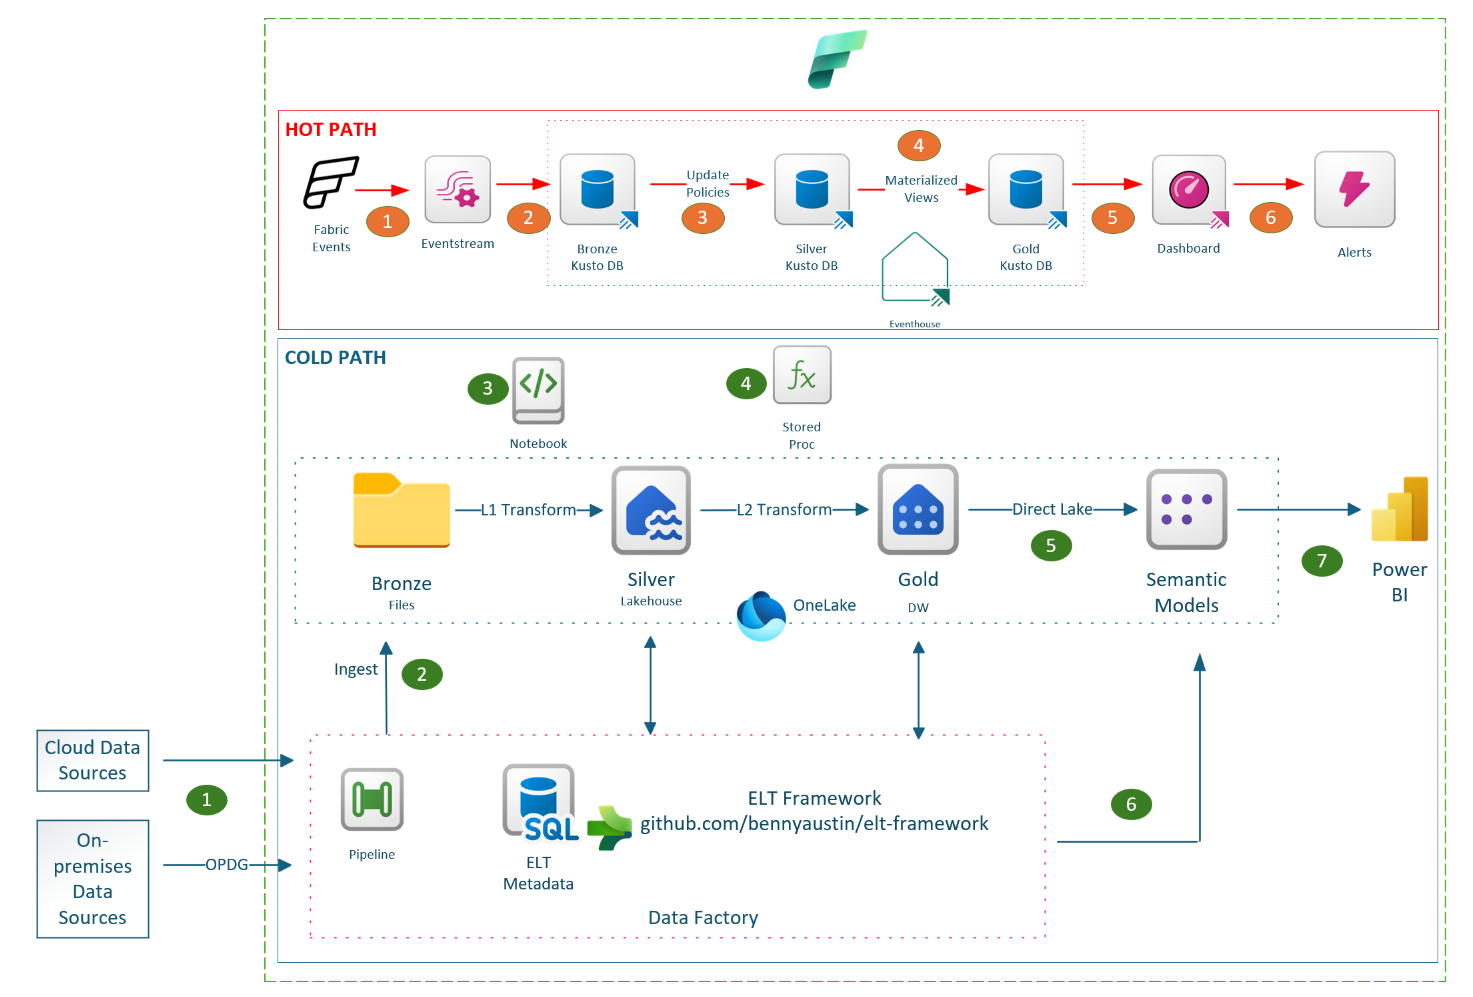
The Fabric Acceleratoris a suite of reusable code components integrated with an orchestration framework designed for Microsoft Fabric, supporting both batch and real-time workloads. It enables automated build, deployment and execution of data platforms on Microsoft Fabric in a consistent and repeatable way. At its core is a metadata-driven ELT (Extract, Load, Transform) frameworkthat orchestrates data workflows. With this release, the metadata layer has transitioned from Azure SQL to Fabric SQL, aligning with the broader evolution of Microsoft Fabric.
The transition to Fabric SQL provides these key benefits:
One less external resource to manage while being fully native to the Fabric ecosystem.
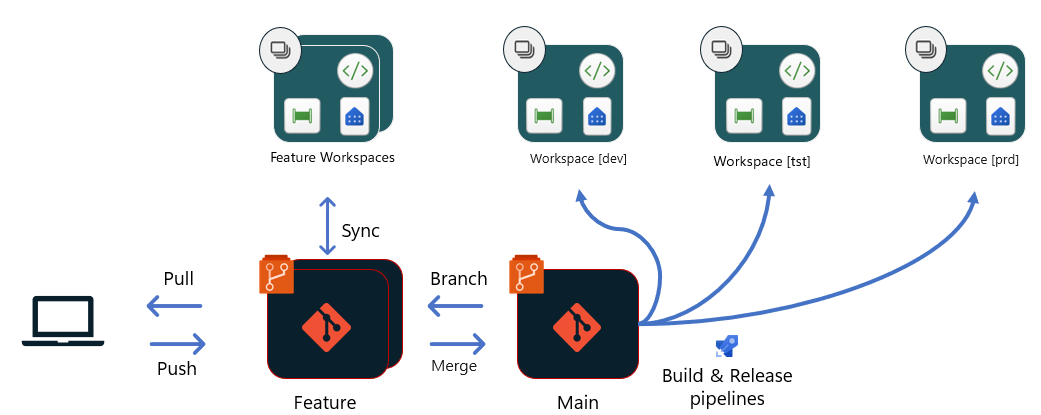
Simplified build experience for data engineers through VS Code and GitHub integration.
Autonomous database capabilities through auto-scaling, auto-optimizing and auto-managed HADR.
Sets the stage for AI driven features through RAG and Vector support.
In addition to Fabric SQL update, a few minor updates also went live in this release. These updates were mainly intended to minimize deployment friction and streamline the overall experience
Purview DG module removed from Infrastructure-as-Code (IaC) deployment. Data Governance is integral part of data strategy. However, based on feedback to simplify deployment and keep the independence of data governance, it was decided to remove Purview DG bicep module from IaC deployment.
Event log ADLS Gen2 storage has been removed from the IaC deployment. With the introduction of real-time observability and the option to persist event logs in OneLake, the separate storage for event logs was no longer necessary.
To reduce dependency on Key Vault during IaC pipeline execution, the Fabric capacity administrator email is now stored as a GitHub repository secret instead of Key Vault secret.
If you are a data engineer and haven’t tried the Fabric Accelerator yet, now’s the time. With Fabric SQL powering the ELT framework, it’s faster, simpler, and ready for AI-driven innovation.
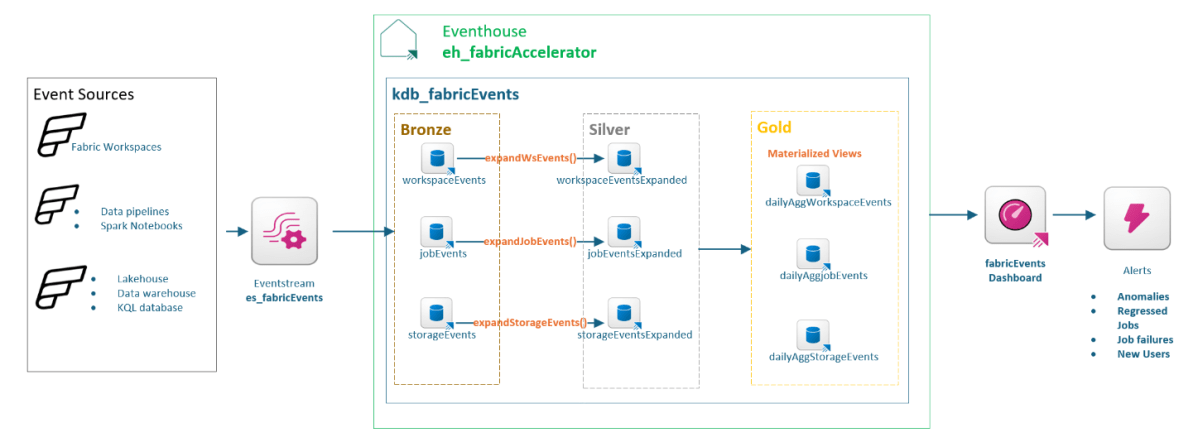
Introducing observability, the first Real-time Intelligence (RTI) workload in Fabric Accelerator. The Fabric Accelerator leverages Fabric events to monitor and alert significant events in real-time, enhancing the observability of your data platform. This observability encompasses all activities within OneLake and all Fabric workspaces, as well as the execution of data pipelines and Spark notebooks.
The following monitoring and alerts are available now
Frequently used Fabric workspaces, item types, items, users, and user actions.
Frequently run data pipelines and Spark notebooks, including elapsed duration, execution status, trigger types, job types, and schedules.
Frequently used OneLake actions by users.
Alerts for job execution anomalies.
Alerts for jobs showing regression trends compared to the last 60 days.
The Fabric Acceleratoris a collection of reusable code artifacts integrated with an orchestration framework for Microsoft Fabric. This accelerator helps you to build, deploy and run data platforms using Microsoft Fabric in a consistent and repeatable manner. It leverages the popular ELT (Extract, Load, Transform) frameworkfor meta-data based orchestration. The ELT Framework is widely used with Azure Synapse and Azure Databricks. It has now been extended to support Microsoft Fabric.
The ability to generate concise summary from pages of text is one of the built-in capabilities of Large Language Models like GPT. This post explains how to summarize text using Azure Open AI.
Quite often I come across transformations that are applicable to several scenarios. So created this reusable Python class that leverages PySpark capabilities to apply common transformation to a dataframe or a subset of columns in a dataframe. The code is in GitHub – bennyaustin/pyspark-utils. There is also an extensive function reference and usage document to go with it. Feel free to use, extend, request features and contribute.
PySpark has built-in functions to shift time between time zones. Just need to follow a simple rule. It goes like this. First convert the timestamp from origin time zone to UTC which is a point of reference. Then convert the timestamp from UTC to the required time zone. In this way there is no need to maintain lookup tables and its a generic method to convert time between time zones even for the ones that require daylight savings offset.
Slowly Changing Dimension (SCD) is great for tracking historical changes to dimension attributes. SCDs have evolved over the years and besides the conventional type 1 (update), type 2 (add row) and type 3 (add column), now there are extensions up to type 7 including type 0. Almost every DW/BI project has at least few type 2 dimensions where a change to an attribute causes the current dimension record to be end dated and creates a new record with the new value.
Power Query can discover and import data from websites. Often data warehouses rely on external data which is readily available in public websites for e.g. public holidays, school holidays, daylight savings, SIC codes, SWIFT codes, post codes etc. Power Query is perfectly suitable for such situations. Power Query can discover, fetch and transform data from a HTML table in a web page into a format that can be easily imported into data warehouses using SSIS package. It’s like an ETL tool for the web page data source. Continue Reading
It’s quite common to analyse a measure by categorizing it into different buckets or bands. For example, to list the customers who are due for payment in the next week or fortnight, to decide which income group to target for a particular product campaign, which age group of students are most likely to buy a smartphone and so on. These bands are usually not supplied by source systems but derived from the underlying measure and they exist only for analytic purposes. While this banding could be achieved in reports or dashboards, there is significant value to model them as dimensions especially to promote self-service BI.