Date dimension is inevitably used in most dashboards. Due to its role playing nature, a specific date dimension used as slicer in one report is different from the date dimension used for another report on the same dashboard page. For example sales reports are based on order date whereas delivery reports are based on delivery dates. On a dashboard that displays both sales and delivery reports, it would not be good for navigation purposes to have both order date and deliver date filters on the same page. The choice of which date dimension to use as filter among the available dates is a tactical decision. Having chosen a particular date dimension, the challenge is to provide filter value to those reports that use a different date dimension. This is where PerformancePoint filter Connection Formula comes into play as explained in the example below.
Continue ReadingSharePoint
SharePoint: MDX Expressions for PerformancePoint Filters
Dashboard filters is one of the key components of BI Platform that drive reports and KPI’s in various dashboards. MDX expressions to a great extent enables to customize PerformancePoint filters and enhance the end user experience.
First – a quick look at member selection option. Member selection is the easiest way to build dashboard filters which does not require MDX expressions (Screen capture 1). Member selection option allows to select specific members, although this is not usually recommended as the filter can become quite static. A better method is to select Children, Leaves or Descendants with additional option to include or exclude default member. For hierarchies, member selection option also allows selection members from a particular level of hierarchy.

Screen Capture 1 – Member Selection
While member selection option may be sufficient for some business scenarios, using MDX Expressions (Screen Capture 2) enables to customize dashboards without hardcoding the member selection.

Screen Capture 2 – MDX Expression Option for PerformancePoint Filters
Some common and often repeated dashboarding scenarios where MDX expressions for PerformancePoint filters are useful is discussed below
Display only members that have data
It’s not particularly intuitive for business users to select an item from drop down only to find that there is no data for the dashboard to display.
The following example uses FILTER function to select only Product Categories that have a sale.
FILTER([Product].[Category].Children,[Measures].[Internet Order Count] > 0)
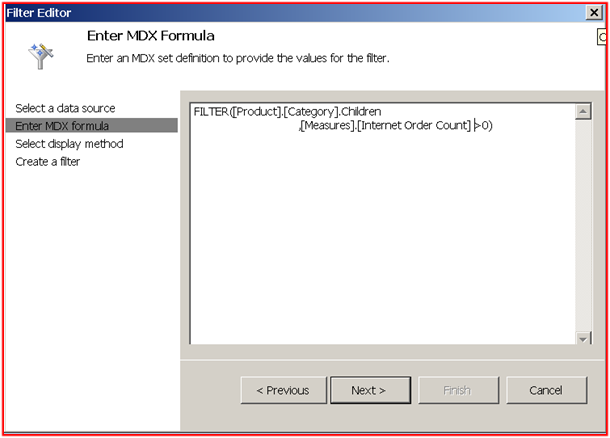
Screen Capture 3 – MDX Expression for PerformancePoint Filter
Display only last N time periods
Often business is only keen on trend analysis for the last few years. All time periods from beginning of time need not be displayed in dashboard.
The following MDX expression displays the last 4 fiscal years from current fiscal year. When the fiscal year changes so does the filter data. Note that for this MDX expression to work, the date dimension must have current attributes defined.
(EXISTS([Date].[Fiscal Year].Children,[Date].[Current Fiscal Year].&[Y]).Item(0).LAG(-4)
: EXISTS([Date].[Fiscal Year].Children,[Date].[Current Fiscal Year].&[Y]).Item(0))
Display time periods in reverse chronology – latest dates first
Another common requirement for business users is to see the latest dates first.
Using the ORDER function in the previous MDX expression, the latest fiscal years can be displayed as the first item in the drop down.
ORDER((EXISTS([Date].[Fiscal Year].Children,[Date].[Current Fiscal Year].&[Y]).Item(0).LAG(-4)
: EXISTS([Date].[Fiscal Year].Children,[Date].[Current Fiscal Year].&[Y]).Item(0))
, [Date].[Fiscal Year].CurrentMember.Properties('key'),DESC)
Hide unknown members
It a good to handle unknown dimension members in datamarts which in turn helps to address data quality issues. However bad data need not be displayed in dashboard filters.
The following MDX expression gets all the Sales Reason members except the unknown members.
([Sales Reason].[Sales Reason].Children
-[Sales Reason].[Sales Reason].&[UNAVAILABLE]
-[Sales Reason].[Sales Reason].&[NOT APPLICABLE]
-[Sales Reason].[Sales Reason].&[UNKNOWN])
The above examples demonstrate the ease with which seriously rocking PerformancePoint filters can be created using simple MDX expressions that create business friendly dashboards.
Benny Austin
Dimension Modeling: Creating Business Friendly Dashboards with CURRENT attributes in Date Dimension
Date Dimension is the most commonly used dimension in any BI implementation. Often used as role playing dimension, there is practically no BI Implementation without date dimension. Adding current indicator attributes with Y/N values to date dimension like current year, current quarter, current month, current week and today enhances dashboarding capabilities and provide better navigation for business users. Continue Reading
Deploying PerformancePoint Content to another SharePoint Site
PerformancePoint Dashboard Designer is usually synchronized with the SharePoint Site from where it was first downloaded. The PerformancePoint Content – Data Connections, Filters, Reports, Scorecards, KPIs and Dashboards from the workspace gets deployed to this SharePoint Site. In most implementations often there is a need to deploy the PerformancePoint Content to a different Business Intelligence SharePoint Site. For instance, deploy dashboards from test to production environment.
If you need to deploy your PerformancePoint content to a different SharePoint Site, follow these steps Continue Reading
SSAS: One Database, many Cubes Vs. One Database per Cube
So you have several cubes to build and perhaps wondering what is the best way to build and deploy your cubes. Should you build all the cubes within the same Analysis Service database or create one database per cube? The following guidelines might help you to choose the best approach to build and deploy your SSAS cubes. Continue Reading
Analysis Service (SSAS) Vs. PowerPivot
This post compares Analysis Services and PowerPivot. Continue Reading…
Load Testing Excel Services Report – Deriving Query String Parameters sr and wb

Visual Studio Team System (VSTS) Test Edition is a valuable tool to load test web applications. This post is about using VSTS Test Edition to load test SharePoint Excel Services report. In particular, I explain the solution to handle session time-out issues encountered with Excel Services web test that could invalidate the load test. Continue Reading
Using Page Viewer Web Part to Display Reporting Services Reports in SharePoint

Page Viewer is an out-of-box SharePoint web part that functions as a placeholder for web pages, folders and files that reside usually outside the SharePoint environment. One such use of Page Viewer is to display a Reporting Service report which is not integrated with SharePoint. This means with a little bit on tinkering Page Viewer can be effectively converted into a Report Viewer. Continue Reading
Avoid Commas in FBA Roles and Members
When implementing Form Based Authentication (FBA) for SharePoint sites, ensure that your role members and role names do not have commas in them. A comma in any role member attribute or in role name, throws “Error: Access Denied” exception. Continue Reading
Getting rid of error message “You do not have permissions to open this file on Excel Services. Make sure that the file is in an Excel Services trusted location and that you have access to the file” in Microsoft Office SharePoint Server (MOSS)
Have you encountered this error message when opening an Excel Service Report in Microsoft Office SharePoint Server (MOSS)?
“You do not have permissions to open this file on Excel Services. Make sure that the file is in an Excel Services trusted location and that you have access to the file.”Continue Reading
